Linear regression is a machine learning algorithm that models the relationship between the dependent and independent variables. It is used for supervised learning tasks where the labels are of continuous data type. Due to its simplicity and effectiveness this algorithm finds application in various fields, including economics, biology, engineering, and social sciences.
Aim of algorithm
The model assumes the straight line connection between the variables and aims to find the best-fit line with the minimum distance between the actual and predicted values.
Types of linear regression
Based on the number of independent variables there are two types of linear regression.
- Simple linear regression
- Multiple linear regression
Simple linear regression
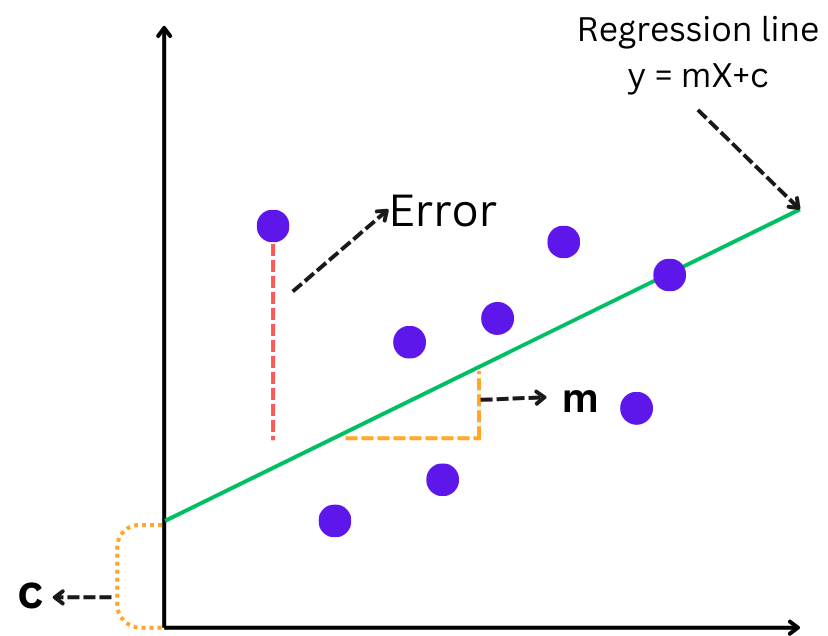
In simple regression, only one independent variable is used to find the values of the dependent variable. Considering the x as the independent variable and y as the dependent variable the straight-line equation for these variables is given as:

Here c is the intercept and m is the slope.
- The slope represents the change in y (dependent variable) for every unit change in x (independent variable).
- Intercept gives the value of y when the independent variable is 0.
The graphical representation is given as:

How to find the best-fit line:
- The objective of the algorithm is to find the best-fit line. The Best fit line has a minimum distance from the data points, and most of the data points lie on that line.
- The best-fit line refers to the best values of model parameters (m, c). For these values of parameters, the error (distance) between the predicted and actual values is minimal.
Cost function
The cost function represents the error, the difference between the actual y and predicted y’ values. It helps to find the best values of model parameters. In linear regression mean squared error is as used as the cost function. For the N training examples, the cost function is given as follows:

The aim is to update the values of parameters such that the cost function continues to decrease and reach its minimum value.
Evaluation Metrics in Linear Regression
Mean absolute error: It is the average of the absolute difference between the actual and predicted values. The formula is given as:

The lower value of MAE is better.
Mean squared error: It is the average square distance between the actual and predicted values. MSE is the most commonly used evaluation metric. The formula is given as:

Root mean squared error: It is the square root of mean square error. The formula is given as:

RMSE provides an error metric in the same units as the dependent variable, making it easier to interpret. Like MSE, a lower RMSE indicates a better fit.
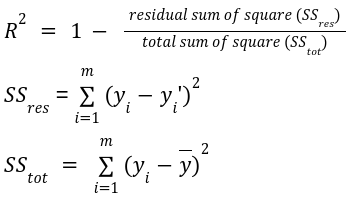
R-squared, also known as the coefficient of determination, measures the proportion of variance in the dependent variable that is predictable from the independent variables. It is calculated as follows:

R ranges from 0 to 1. An R-squared value of 1 indicates that the model predicts the dependent variable perfectly. An R2 of 0 means that the model does not explain any of the variance in the dependent variable.
Adjusted R-squared: It is the improved form of R-squared. The value of the R-squared measure increases with an increase in the number of features, giving a false indication that the model is performing well. Adjusted R-square value considers only important features and solves the problem of R-squared measure. The formula is given as:

Multiple linear regression
In multiple linear regression, more than one independent variables are involved to determine the value of the dependent variable. The equation for the multiple linear regression is given as:
